Product tour
Inside the workflow workspace.
Follow a process from editable steps to inspectable results. Screenshots show the desktop app; the short animations illustrate how the tools work.
Graph and code
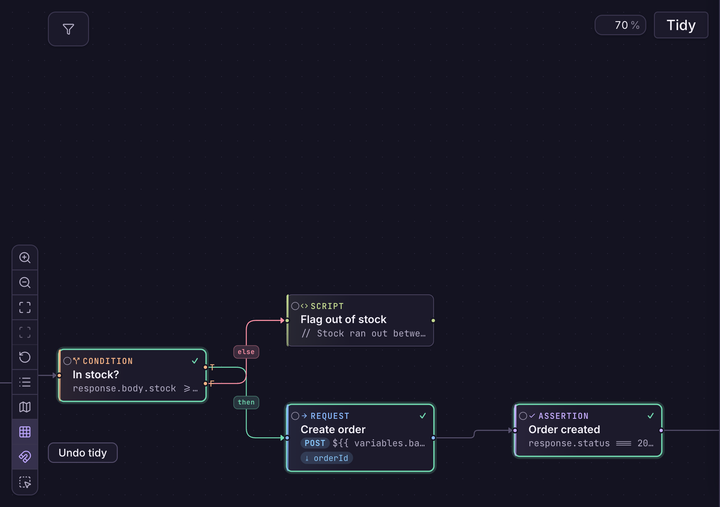
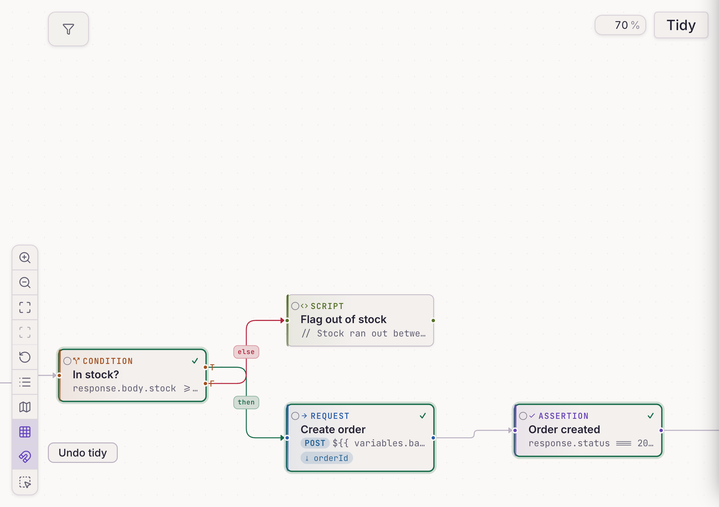
Two views of the same process.
Edit the steps and routing visually, or work directly with the YAML in your repository.
Results and variables
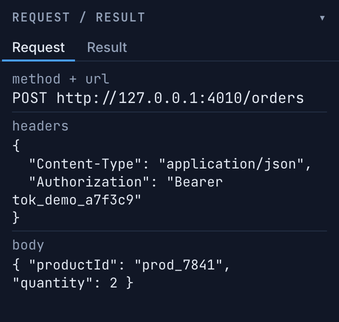
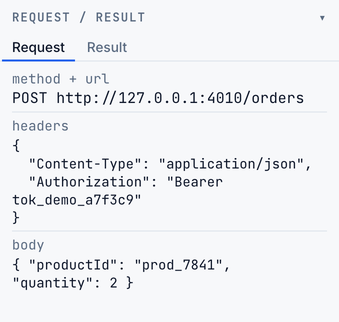
Inspect the values each step uses.
Open the resolved request and response, then inspect the values captured for later steps.


Optional model assistance
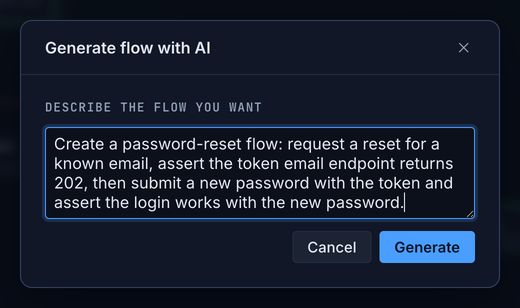
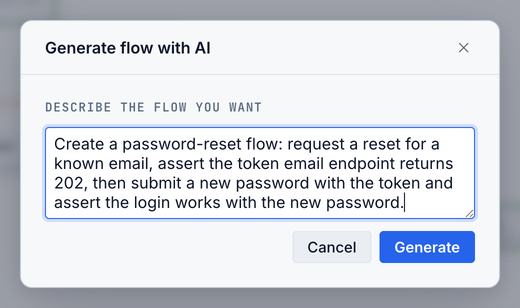
Start a workflow from a description.
Connect your own model to help draft steps. Review the generated workflow and run it against sample inputs.
For API workflows
Keep requests aligned with your spec.
Compare a workflow with an OpenAPI definition and review suggested fixes when endpoints change.
From the current build
Screenshots of the app as it is today.
Captured from the real desktop app, the same build the end-to-end suite runs against. No mockups, no repaints.
Graph editor
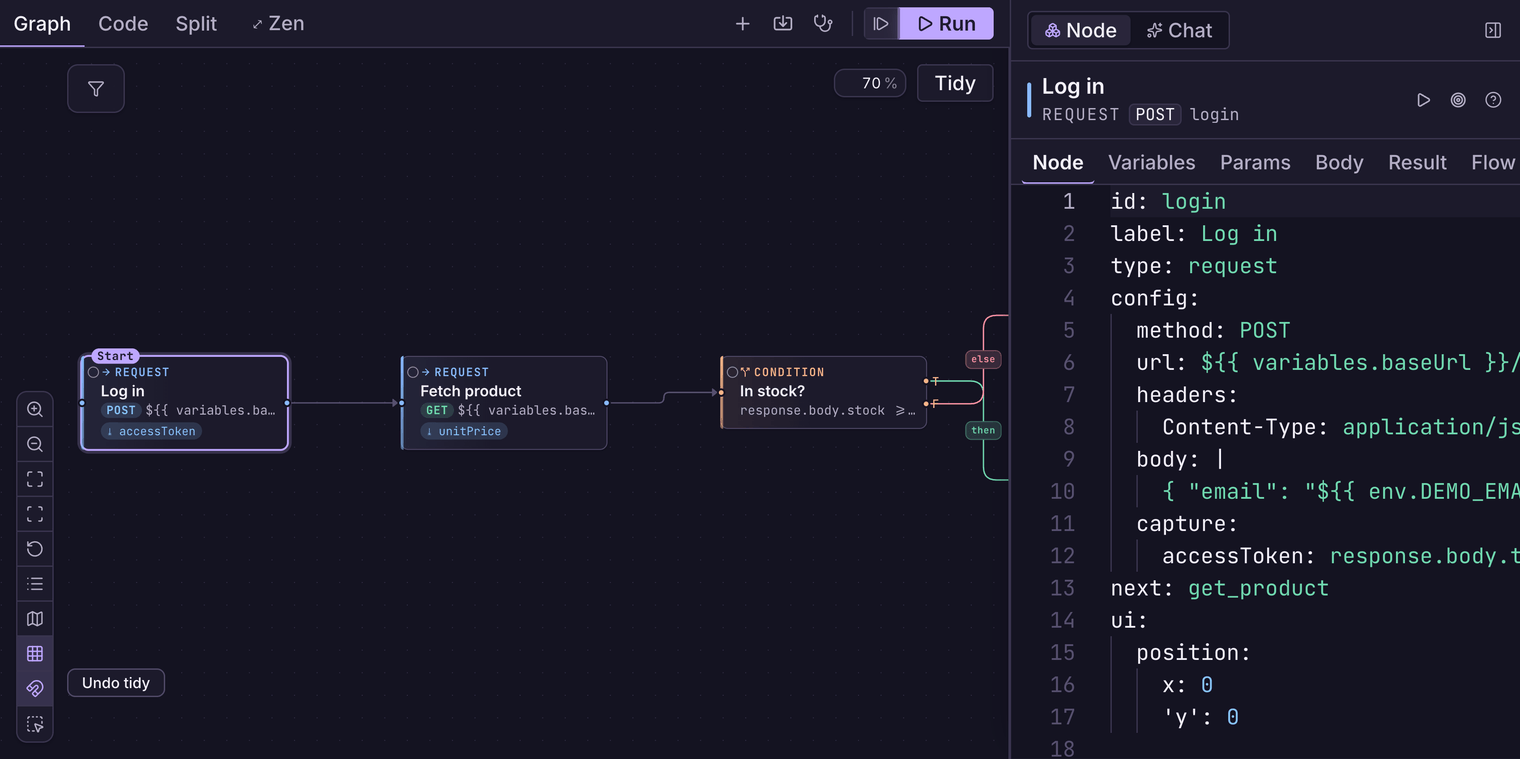
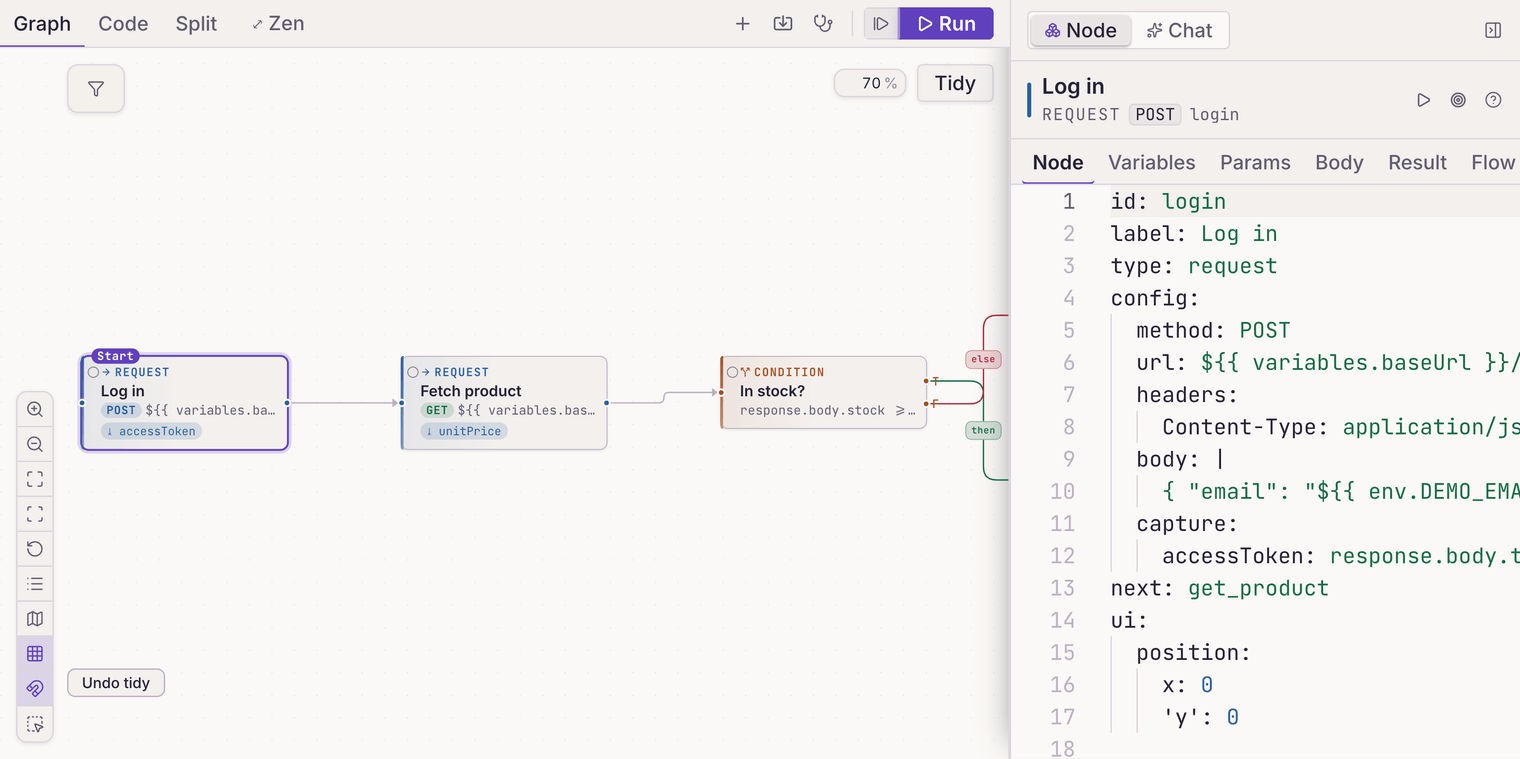
Model the scenario the way you'd whiteboard it.
Login, capture the token, spend it downstream. The graph is the test. Every node in it is still real, editable code underneath.
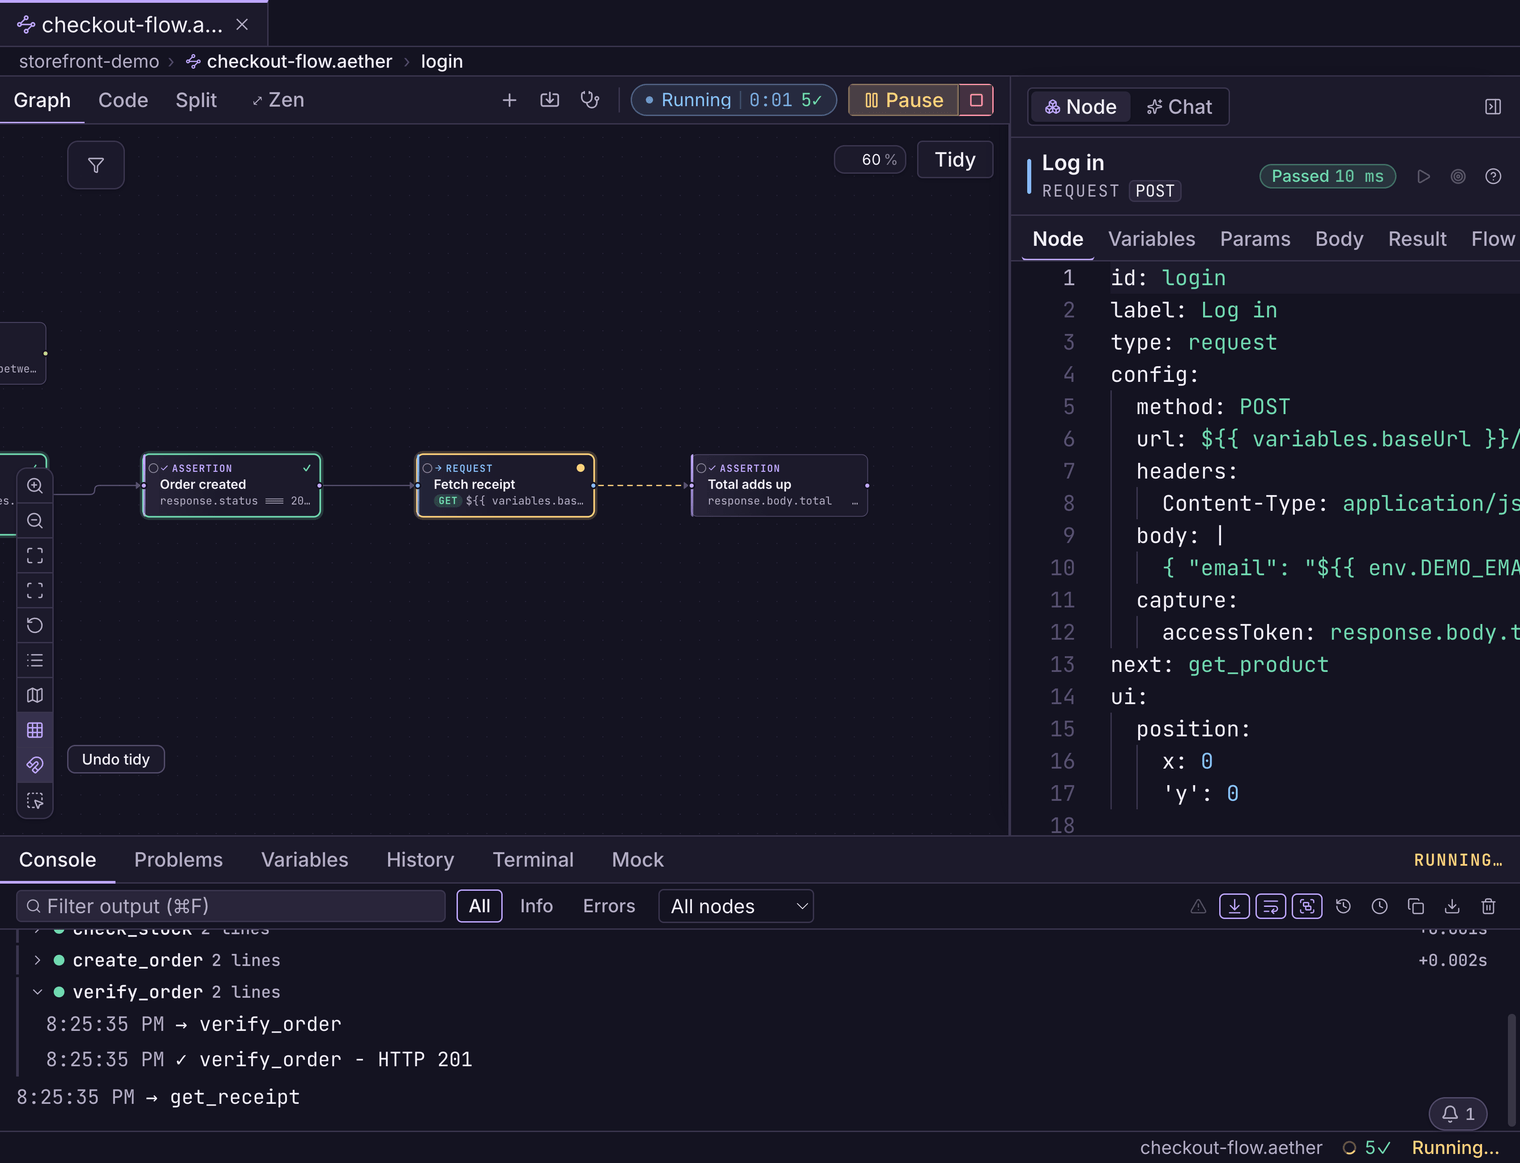
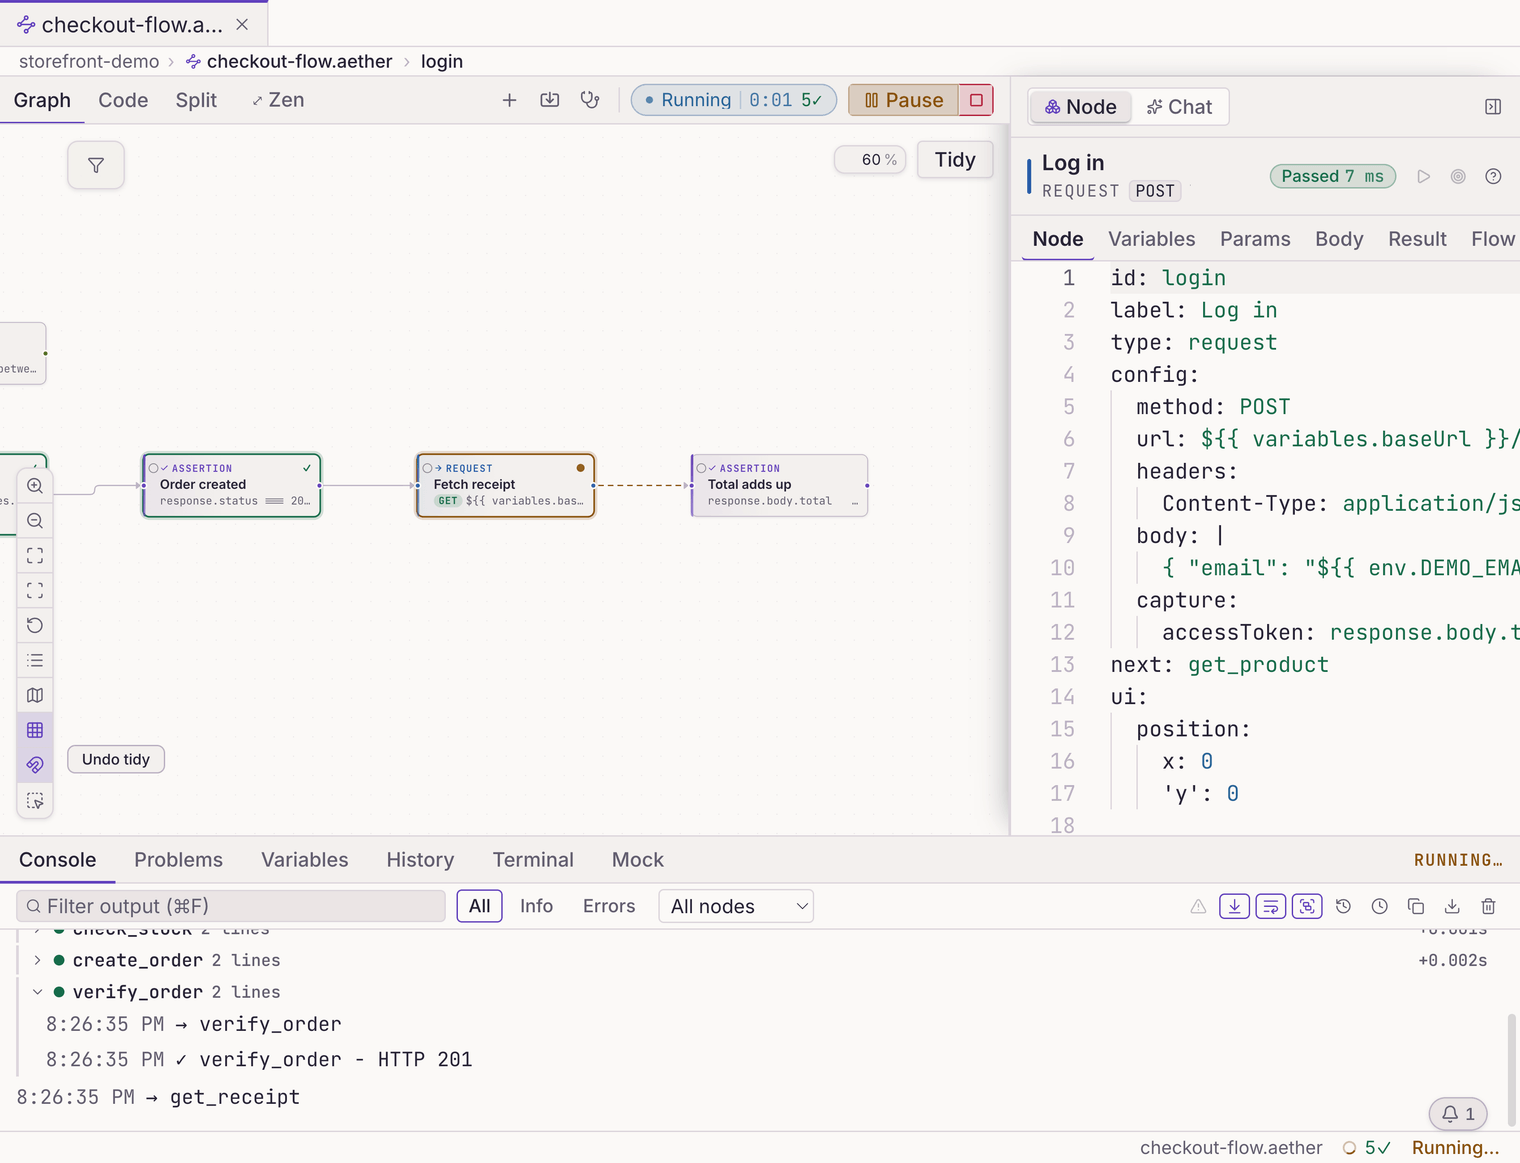
Execution
Runs you can watch, then interrogate.
Nodes light up as they pass or fail, and any one of them will show you the exact request and response it produced.
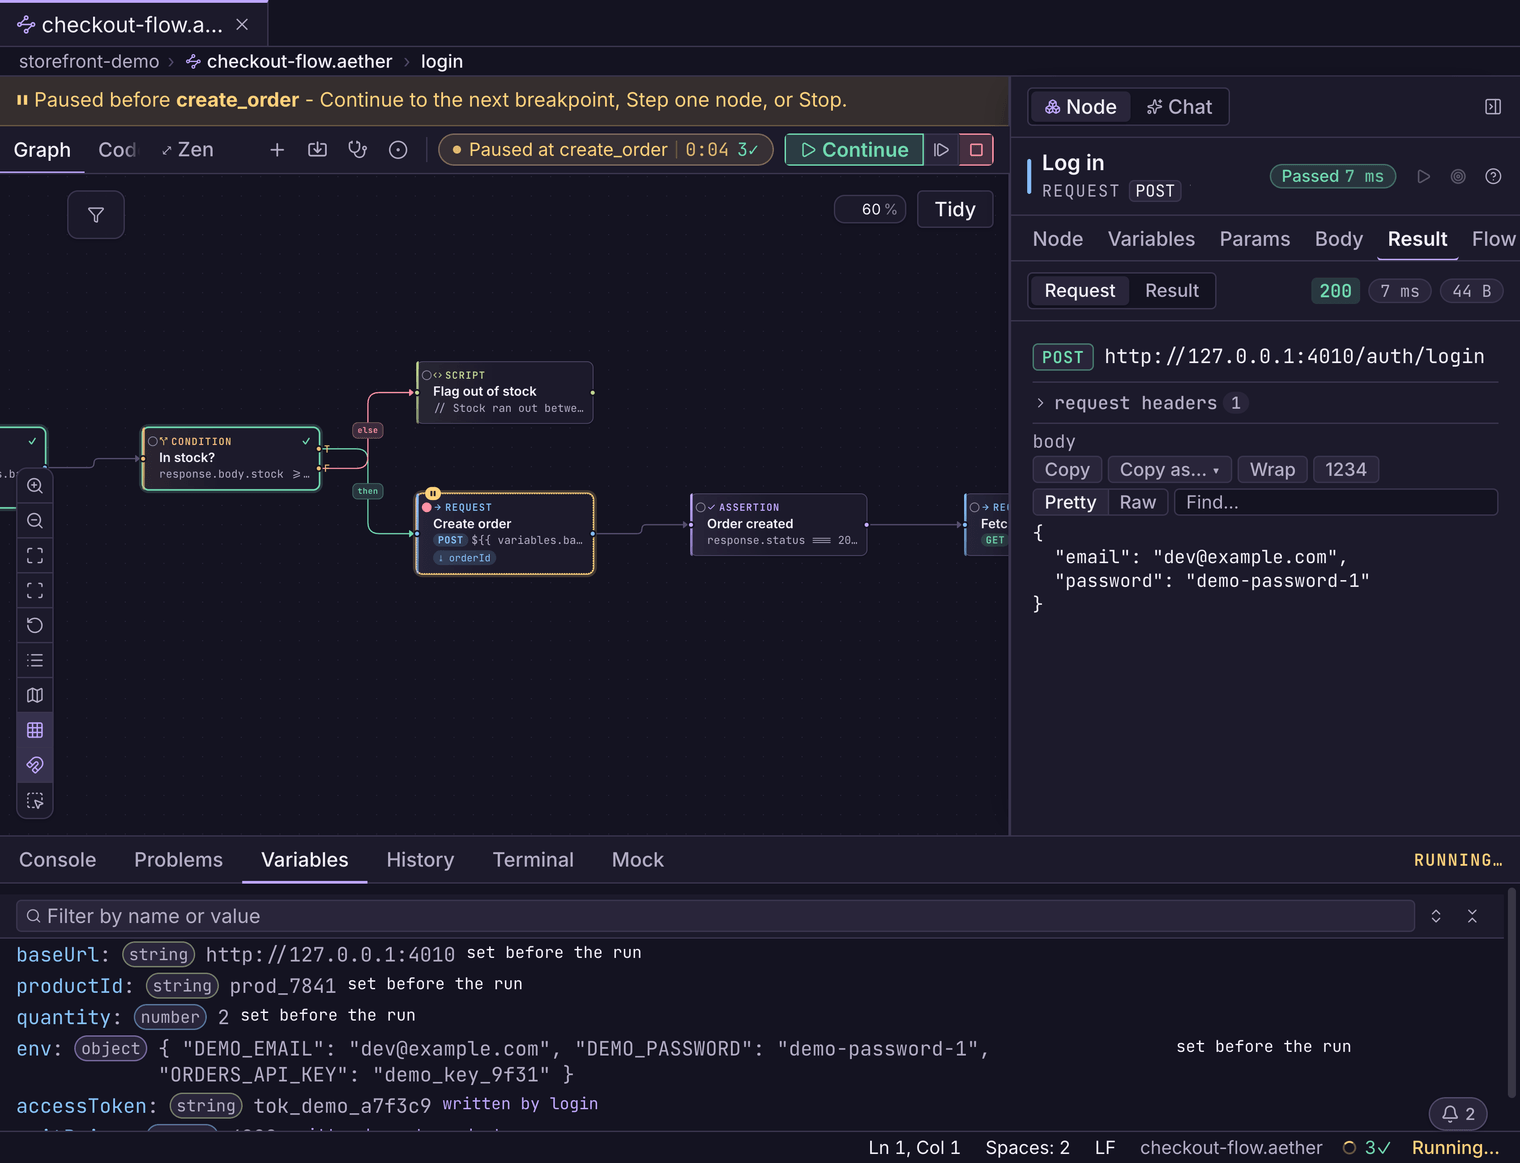
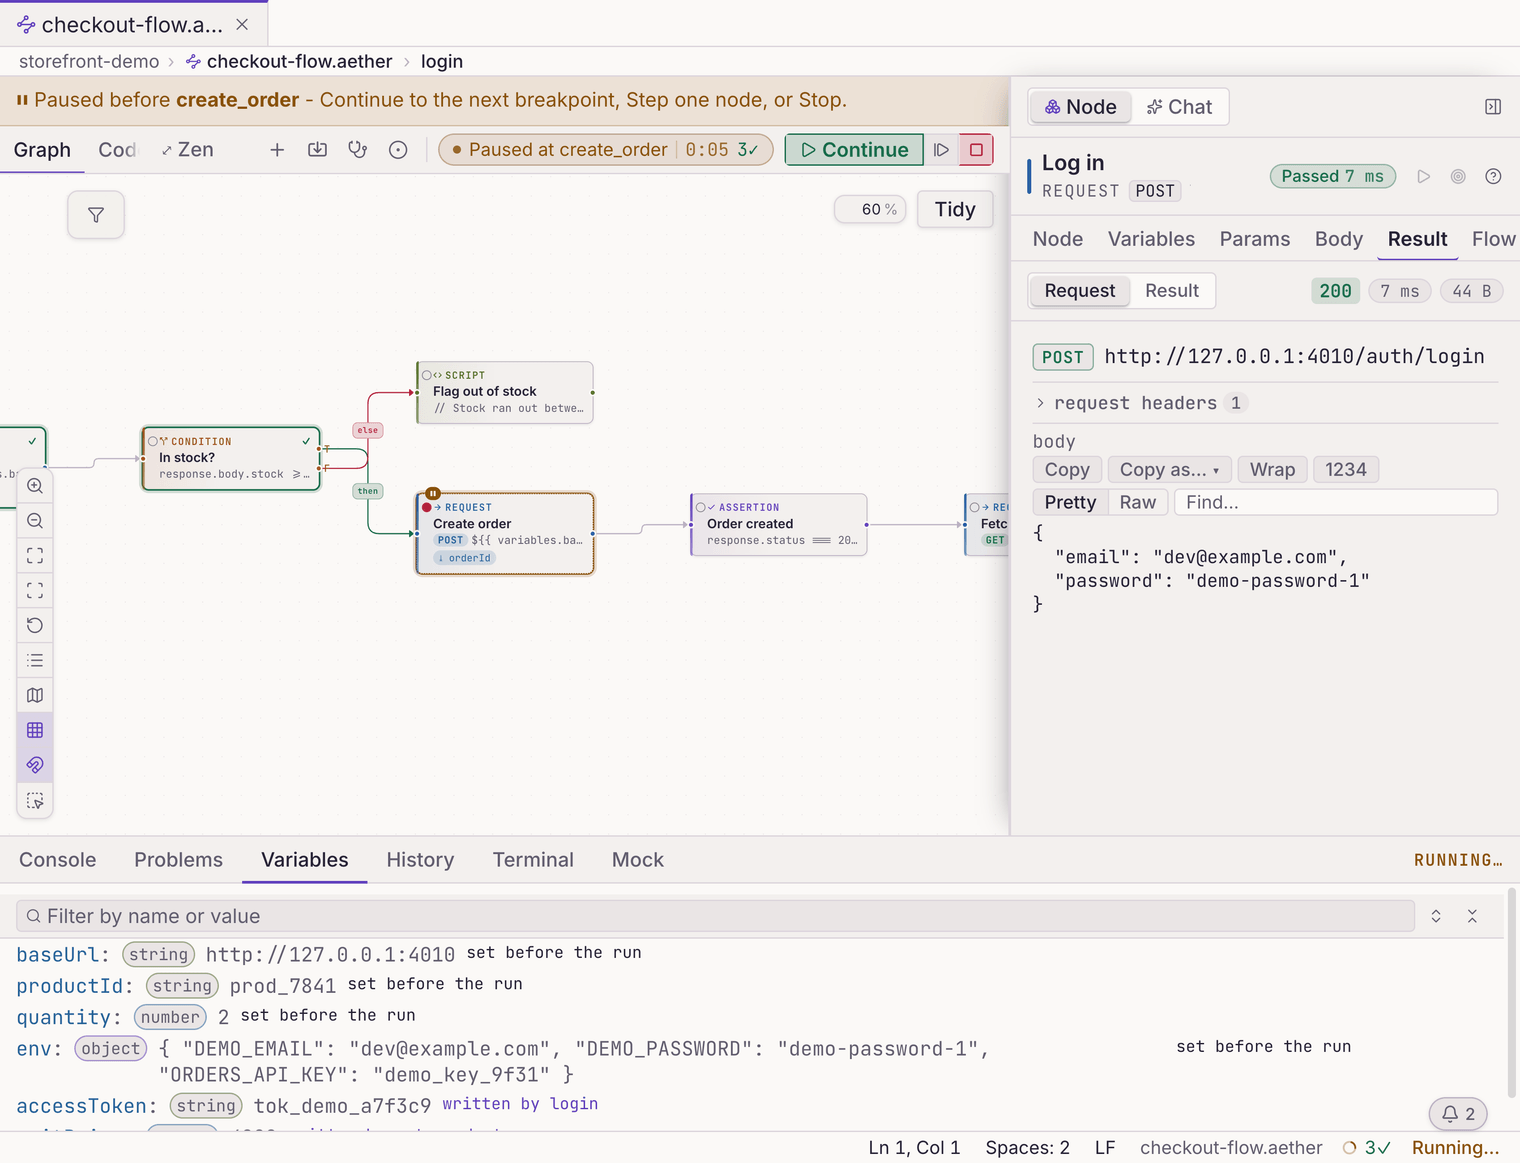
Step-through debugging
Pause mid-flow and see exactly what happens next.
Set a breakpoint and run: execution halts before that node fires, with the variables panel showing what the next call is about to spend. Breakpoints live in your editor, never in the .aether file.